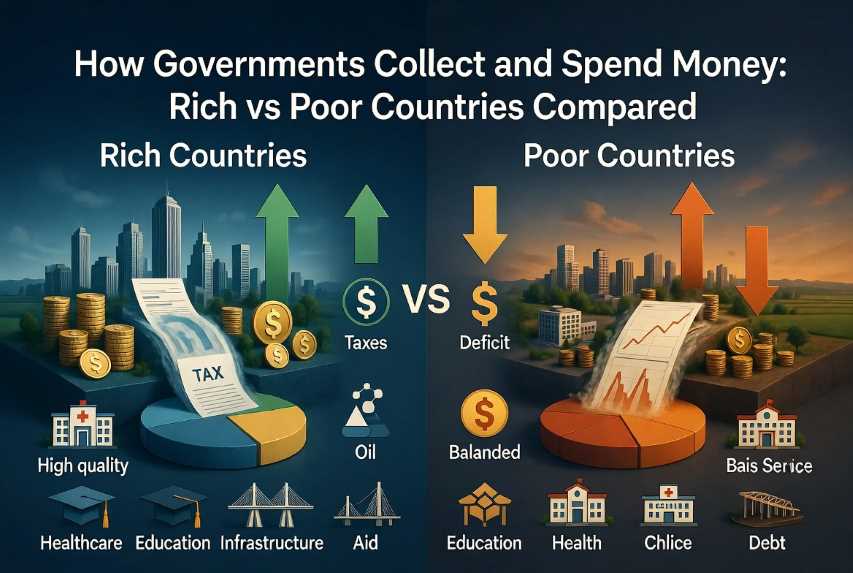
A public budget is the central financial plan that shows how a government expects to collect money and how it intends to spend that money over a defined period, usually one fiscal year. It is far more than an accounting document. The budget is one of the most powerful instruments any society has for shaping economic growth, distributing opportunity, providing essential services, and determining the quality of daily life for millions of people. Understanding where governments get their money, how they allocate it, and why the patterns differ so sharply between rich and poor countries helps explain why some nations enjoy high living standards and strong public services while others struggle with shortages, inequality, and repeated fiscal crises.
What Is a Public Budget?
A public budget is a formal statement of projected government revenues and planned expenditures for a specific period. Its core purposes are to finance public goods and services that markets alone cannot efficiently provide, to redistribute resources in ways society considers fair, to stabilize the economy during booms and recessions, and to support long-term development goals such as education, infrastructure, and innovation.
Every modern government needs a budget because the functions of the state—defense, law and order, roads, schools, hospitals, courts, environmental protection, and social safety nets—require large and predictable flows of money. Without a planned budget, spending would become arbitrary, taxes would be unpredictable, investors would lose confidence, and public trust would erode. A well-prepared budget also forces political leaders to make visible trade-offs: more money for one priority usually means less for another.
Three basic outcomes are possible each year:
A budget surplus occurs when revenues exceed spending. The surplus can be used to reduce debt, build financial reserves, or fund future investments without new borrowing.
A budget deficit occurs when spending exceeds revenues. The shortfall is typically covered by issuing government bonds or taking loans. Occasional deficits can be useful during crises or for productive investment, but persistent large deficits raise the stock of public debt.
A balanced budget occurs when revenues and spending are roughly equal. Few countries achieve exact balance every year; most aim for sustainability over the economic cycle.
The size of the budget relative to the economy (measured as a share of GDP) and the quality of spending decisions matter more than the simple surplus or deficit label. A large budget spent wisely on productive assets can raise living standards; a smaller budget wasted on inefficiency or corruption achieves little.
Main Sources of Government Revenue
Governments draw on a wide range of revenue sources. The mix varies according to a country’s level of development, natural resource endowments, administrative capacity, and political choices.
Income taxes are levied on the earnings of individuals and households. Progressive systems tax higher incomes at higher rates, which can reduce inequality while generating substantial revenue in economies with large formal sectors and strong tax administrations. In many lower-income countries, a large informal sector limits the reach of income taxes.
Corporate taxes are paid by companies on their profits. Collection depends heavily on the ability of tax authorities to audit large firms, including multinationals that may shift profits across borders. Some countries offer tax incentives to attract investment, which can reduce immediate revenue in the hope of longer-term growth.
Value Added Tax (VAT) and sales taxes are consumption taxes. VAT is applied at each stage of production and distribution, with credits for taxes already paid, making it harder to evade than a simple retail sales tax. Many countries rely on VAT because it generates steady revenue even when income tax collection is weak. Rates typically range from 5 percent to 25 percent.
Customs duties and tariffs are taxes on imported (and sometimes exported) goods. They remain important in many developing countries that have limited domestic tax bases and rely on trade for revenue. As economies modernize and join trade agreements, the relative importance of tariffs usually declines.
Oil, gas, and natural resource revenues come from royalties, production-sharing contracts, special resource taxes, and dividends from state-owned energy companies. Resource-rich countries can enjoy large windfalls when prices are high, but heavy dependence creates volatility and the risk of the “resource curse”—weak institutions, Dutch disease, and underinvestment in other sectors.
State-owned enterprises contribute dividends, profits, or transfers. National oil companies, electricity utilities, telecom operators, and mining firms can be major revenue sources when well managed. When poorly run, they become drains on the budget through subsidies and losses.
Tourism generates revenue through visitor taxes, airport and hotel fees, and broader economic activity that expands the tax base. Island nations and countries with strong cultural or natural attractions often treat tourism as a strategic revenue pillar.
Foreign aid and grants provide significant support for many low-income countries. These flows can finance development projects and fill budget gaps, but they often come with conditions and can create dependency or reduce incentives for domestic revenue mobilization.
Borrowing through government bonds and international loans allows governments to spend more than they collect in any given year. Domestic bonds are sold to citizens, banks, and pension funds. International loans come from capital markets, multilateral institutions such as the IMF and World Bank, or bilateral lenders. Borrowing is not free; interest payments become a permanent claim on future budgets.
Other revenue sources include property taxes, excise taxes on fuel, alcohol, tobacco, and sugar-sweetened drinks, license and user fees, privatization proceeds, and investment income from sovereign wealth funds.
Major Government Spending Categories
Public spending is typically organized into these broad categories, though the relative weights differ greatly across countries:
Education: Primary and secondary schools, teacher salaries and training, universities, vocational programs, and student support. Investment here shapes long-term productivity and social mobility.
Healthcare: Hospitals, clinics, medicines, vaccination programs, public health campaigns, and health insurance schemes. Quality and access have direct effects on life expectancy and workforce productivity.
Infrastructure: Roads, bridges, ports, airports, railways, water and sanitation systems, electricity grids, and digital networks. Good infrastructure lowers business costs and improves daily life.
Defense and national security: Armed forces, intelligence services, border control, and internal security. Spending levels reflect geopolitical risks and strategic choices.
Social welfare and pensions: Cash transfers, unemployment benefits, disability support, child allowances, and old-age pensions. These programs reduce poverty and provide insurance against life risks.
Public sector salaries: Wages and benefits for civil servants, teachers, doctors, police, judges, and other government employees. In many countries this is one of the largest single items.
Agriculture: Subsidies, research, irrigation, extension services, and rural development programs. Critical in economies where large shares of the population still work in farming.
Scientific research and innovation: Funding for universities, public laboratories, and technology development. Supports long-term competitiveness.
Environmental protection: Pollution control, conservation, climate adaptation, and renewable energy. Growing in importance as climate risks rise.
Debt interest payments: The cost of servicing past borrowing. In highly indebted countries this can crowd out spending on education, health, and infrastructure.
Emergency and disaster relief: Response to floods, earthquakes, pandemics, wars, and economic crises. Unpredictable but often large when needed.
The balance among these categories reveals a country’s priorities and constraints.
How Public Budgets Differ Between Rich and Poor Countries
Revenue structure: High-income countries typically raise most revenue from broad-based personal income taxes, social security contributions, corporate taxes, and consumption taxes. Their formal economies and strong institutions support high tax-to-GDP ratios, often in the 25–45 percent range. Lower-income countries rely more heavily on customs duties, natural resource rents, and aid because their formal tax bases are smaller, harder to administer, and more vulnerable to evasion.
Spending priorities: Richer countries devote larger shares of GDP to social protection, healthcare, and education. Poorer countries must often prioritize basic infrastructure, agriculture support, and debt service while still struggling to fund essential services at adequate levels.
Tax collection efficiency: Advanced economies have better systems for registering taxpayers, cross-checking data, and enforcing compliance. Many developing countries face large informal sectors, weak administrative capacity, and political resistance to broadening the tax base.
Government borrowing: Rich countries usually borrow in their own currencies at relatively low interest rates. Poorer countries often face higher rates and may need to borrow in foreign currencies, exposing them to exchange-rate risk.
Public debt: Both groups can accumulate high debt, but richer countries generally have greater capacity to sustain it because of deeper capital markets, stronger growth potential, and better institutions. For many poorer nations, high debt service consumes a large share of scarce revenues.
Economic stability: Diversified tax bases and credible institutions in rich countries provide more fiscal buffers. Resource-dependent or aid-dependent budgets in poorer countries are more vulnerable to commodity price swings, donor decisions, and external shocks.
Impact on the Economy
Government budgets influence the wider economy through several channels:
Economic growth: Productive spending on infrastructure, education, and health raises long-term potential growth. Wasteful spending or excessively high taxes that discourage work and investment can slow it.
Inflation: Large deficits financed by money creation can push prices upward. Disciplined budgets help keep inflation under control.
Employment: Public spending creates jobs directly in government and indirectly through contracts and higher demand. Tax policy also shapes private hiring incentives.
Investment: Predictable fiscal policy and reliable infrastructure attract private investment. High and rising debt or policy uncertainty can deter it.
Interest rates: Heavy government borrowing can push up interest rates and “crowd out” private borrowers. Sound public finances support lower rates.
Currency strength: Credible budgets and sustainable debt paths support a stronger currency. Persistent deficits and rising debt can weaken it.
National debt: Deficits add to the stock of debt. Rising debt increases interest costs and can constrain future policy choices.
Long-term development: Consistent investment in human capital and productive assets builds the foundations for higher living standards over decades. Short-term political spending often undermines this process.
Impact on People's Daily Lives
Budget decisions affect almost every aspect of ordinary life:
Cost of living: Taxes, subsidies on fuel and food, and the inflationary effects of deficits all influence the prices families pay.
Education quality: Funding levels determine class sizes, teacher quality, school buildings, textbooks, and access to higher education and vocational training.
Healthcare services: The availability of public hospitals, free or subsidized medicines, vaccination coverage, and health insurance depends directly on budget allocations.
Transportation: The quality and extent of roads, public transit, ports, and airports shape commuting times, logistics costs, and economic opportunity.
Housing: Public housing programs, land policies, and housing subsidies affect affordability and living conditions.
Electricity and water: Investment and operating subsidies determine the reliability and cost of basic utilities that households and businesses need every day.
Food prices: Agricultural support, import policies, and food subsidies influence what families pay at markets and stores.
Job opportunities: Public works programs, education quality, overall economic stability, and the business climate shaped by fiscal policy all affect employment prospects.
Social support: Pensions, unemployment benefits, disability payments, and cash transfers provide safety nets, especially for the elderly, children, and vulnerable groups.
Poverty and inequality: Progressive taxation combined with well-targeted spending can reduce poverty and narrow gaps. Poorly designed policies can widen them.
Comparison Between Rich and Poor Countries
The following table summarizes approximate recent patterns (mid-2020s orders of magnitude) across key indicators. Individual countries vary, and figures shift with economic conditions.
| Indicator | High-Income / Resource-Rich Examples (Norway, Switzerland, Germany, USA, Singapore, Japan, Saudi Arabia, UAE) | Middle- and Lower-Income Examples (China, India, Brazil, Nigeria, Turkey, Egypt) |
|---|---|---|
| Government revenue | Broad tax base or large resource/SWF income; tax-to-GDP often 25–45% | Narrower base; more resource/aid dependence; often 10–25% |
| Tax rates & collection | Higher effective rates, stronger administration | Lower effective rates due to informality and weaker collection |
| Healthcare | Near-universal or high-quality coverage | Variable access; significant out-of-pocket costs common |
| Education | High public investment and generally strong outcomes | Expanding access but quality and completion gaps remain |
| Infrastructure | Modern and well-maintained | Improving but often capacity-constrained |
| Public services | Generally reliable and comprehensive | Uneven quality and coverage |
| Debt levels | High absolute levels possible but greater sustainability capacity | Often high relative to revenue; higher interest costs and refinancing risks |
| GDP per capita | Typically, $35,000–$120,000+ | Typically, $3,000–$20,000 |
| Poverty rates | Low | Higher, though declining in many cases |
| Average salaries | High | Much lower in absolute terms |
| Unemployment / underemployment | Moderate with stronger safety nets | Often higher underemployment and large informal sectors |
| Quality of life | High rankings on health, education, safety, environment | Improving but significant gaps remain |
Real-World Case Studies
Norway: Oil and gas revenues are channeled into the Government Pension Fund Global, one of the world’s largest sovereign wealth funds (exceeding $2 trillion). Only a small expected real return (around 3 percent) is spent each year under a strict fiscal rule. High taxes fund excellent public services. The result is high living standards, low poverty, and strong intergenerational equity.
Switzerland: A highly diversified tax base with significant cantonal autonomy supports prudent fiscal policy. Strong private sector, high savings, and excellent infrastructure underpin high living standards with a relatively moderate overall government size.
Germany: A high tax-to-GDP ratio finances a comprehensive welfare state, strong vocational education, and advanced infrastructure. Social insurance contributions play a major role. The system delivers low poverty but faces pressure from an aging population.
United States: Lower overall tax-to-GDP than many European peers, with heavy reliance on individual income taxes. Significant private provision of healthcare and education exists alongside large federal spending on defense and entitlement programs. Persistent deficits and rising debt remain ongoing challenges.
Singapore: Low tax rates combined with highly efficient collection, land-related revenues, and returns from sovereign wealth funds. Strong focus on education, infrastructure, and housing has produced rapid development and high living standards through disciplined fiscal policy.
Japan: Very high public debt (among the highest as a share of GDP) is largely held domestically. An aging population drives large social security spending. High-quality public services coexist with long-term sustainability concerns.
China: A mix of taxes, land sales, and state-enterprise contributions has financed massive infrastructure investment and rapid growth. Local government debt and the need to rebalance toward consumption and services are key issues. Extreme poverty has fallen dramatically.
India: Expanding the tax base through the Goods and Services Tax (a form of VAT) and digitalization. A large population requires heavy investment in basic services. Subsidies, welfare schemes, and infrastructure dominate spending. Informality and state-level variations remain challenges.
Brazil: A relatively high tax burden for a middle-income country, a complex tax system, and large social programs (including pensions and cash transfers). Commodity revenues matter. Inequality and fiscal rigidities are persistent issues.
Nigeria: Heavy dependence on oil revenues leaves the budget vulnerable to price swings. Non-oil tax collection remains low relative to potential. Debt service and subsidies consume significant resources. Improving domestic revenue mobilization is a central priority.
Turkey: Tax revenues form the backbone of the budget, with strong contributions from income tax, domestic and import VAT, and special consumption taxes. Debt-to-GDP has remained relatively low (around 24 percent in recent data). In recent years strong growth in tax collections has helped narrow deficits even as spending on personnel, transfers, and interest continues. The economy’s industrial base and large domestic market support revenue growth, though inflation and currency volatility have historically complicated fiscal management. Public spending prioritizes current operations and social transfers while infrastructure and education remain important longer-term goals.
Egypt: Tax revenue as a share of GDP remains relatively low (around 12–15 percent in recent years). Debt service has become a dominant claim on the budget, at times absorbing the majority of revenues or half of total expenditures. The government has worked to reduce the debt-to-GDP ratio from peaks near 96 percent toward the low-to-mid 80s and aims for further declines. Primary surpluses have been achieved in some periods, yet interest payments continue to crowd out spending on education and health relative to constitutional targets and population needs. Large food and energy subsidies, a sizable public wage bill, and ongoing reforms supported by international partners shape the fiscal landscape. Revenue mobilization through VAT and other taxes is a continuing priority.
Saudi Arabia: Oil remains the largest single source of government revenue, but Vision 2030 has driven a deliberate diversification strategy. Non-oil revenues—especially VAT at 15 percent, fees, and investment income—have grown substantially and now account for a significant share of the total. The Public Investment Fund (with assets approaching or exceeding $900 billion) plays a central role in both domestic mega-projects and international investments. Budgets have swung between surplus and deficit depending on oil prices and spending on transformation projects, defense, and social programs. The strategy aims to reduce oil dependence while maintaining high living standards and creating private-sector jobs.
United Arab Emirates: Oil and gas remain important, especially in Abu Dhabi, but the overall economy and budget have diversified more successfully than many peers. Dubai’s model emphasizes tourism, finance, trade, logistics, and real estate. Multiple large sovereign wealth funds (combined assets estimated near or above $2 trillion) provide substantial investment income and fiscal buffers. Tax burdens are low by international standards (no personal income tax in most cases, with corporate tax and VAT introduced more recently). High-quality infrastructure, efficient public services, and a business-friendly environment support high GDP per capita and attract talent and capital. Fiscal policy emphasizes sustainability and continued diversification.
Common Budget Challenges
Governments everywhere confront difficult problems:
Corruption and leakage divert resources from intended purposes.
Tax evasion and avoidance shrink the effective revenue base.
High public debt raises interest costs and reduces policy flexibility.
Inflation erodes the real value of budgets and fixed incomes.
Rapid population growth increases demand for schools, hospitals, and jobs.
Aging populations raise pension and healthcare costs.
Economic recessions cut revenues while raising spending needs.
Wars and conflicts destroy capital and force emergency outlays.
Natural disasters require sudden large expenditures.
Climate change creates both adaptation costs and potential revenue losses from fossil fuels.
How Governments Can Improve Public Finances
Practical improvements include:
Designing broader, fairer, and simpler tax systems supported by digital collection and better compliance.
Systematically identifying and reducing wasteful or low-priority spending.
Expanding digital government services to lower costs and improve delivery speed and transparency.
Strengthening independent audit institutions, public reporting, and parliamentary oversight.
Enforcing anti-corruption measures and reducing opportunities for leakage.
Investing consistently in education, skills, and innovation to raise future productivity and the tax base.
Creating a predictable business environment that supports private-sector growth and formal employment.
Interesting Facts and Statistics
OECD countries averaged a tax-to-GDP ratio of roughly 34 percent in recent data.
Government spending as a share of GDP commonly exceeds 40–50 percent in many European countries and is often below 30 percent in lower-income nations.
Resource-rich Gulf countries have built some of the world’s largest sovereign wealth funds, providing buffers that most other nations lack.
In several highly indebted developing countries, debt service can consume 20–50 percent or more of government revenue or expenditure in difficult years.
Countries with strong fiscal institutions and diversified revenue bases generally deliver more reliable public services and greater resilience to shocks.
High-income countries typically achieve near-universal access to basic healthcare and secondary education; large gaps in access and quality persist in many lower-income settings.
Frequently Asked Questions (FAQ)
Why do governments borrow money? To finance deficits caused by investment needs, economic downturns, or emergencies when current revenues are insufficient. Borrowing can spread the cost of long-lived assets (roads, schools, hospitals) across the generations that benefit from them.
Can a country print unlimited money? No. Creating money without a corresponding increase in goods and services leads to inflation or hyperinflation, which destroys purchasing power and confidence in the currency. Responsible central banks limit money creation.
Why do taxes differ between countries? Differences reflect political choices about the desired size of government, administrative capacity, economic structure, natural resource endowments, and cultural attitudes toward redistribution and public services.
What happens if a government spends more than it earns? It runs a deficit and must borrow or draw down reserves. Persistent large deficits raise the stock of debt, increase interest costs, and can eventually force difficult adjustments or trigger crises.
Which countries have the highest taxes and why? Nordic countries and several Western European nations typically have the highest overall tax burdens. They use the revenue to fund extensive social services, universal healthcare, and high-quality education that their citizens have collectively chosen to support through the political process. Some resource-rich countries achieve high public spending with lower conventional tax rates by relying on oil, gas, or sovereign wealth fund income.
Responsible public budgeting is foundational to sustainable economic growth, higher living standards, and long-term national prosperity. How governments raise money and how carefully they spend it determines whether citizens receive reliable schools, hospitals, infrastructure, and safety nets—or face chronic shortages, high debt burdens, and repeated instability.
Rich and poor countries, oil exporters and diversified economies, face different constraints and opportunities, yet the core principles remain the same: broaden the revenue base fairly and efficiently, spend productively on human capital and infrastructure, maintain transparency and accountability, and keep debt on a sustainable path. Countries that manage these tasks well create virtuous cycles of investment, opportunity, and rising living standards. Those that fail risk stagnation, inequality, and recurring crises. Sound public finances are not merely technical exercises in accounting; they are among the most powerful tools societies possess for shaping a better future for current and future generations.
 |  |  |
 | ![[UPGRADED] Small Safes for Home, 0.30 Cuft Mini Safe Box | with Fireproof Waterproof Bag, Digital Money Safe with Programm...](https://m.media-amazon.com/images/I/71gMMU8jwdL._AC_UL320_.jpg) |  |